Debugging Electronic Reporting Models in Dynamics 365 Finance & Supply Chain Management
Posted by Author, Canine & Equine Choreographer, Citizen AI Data Scientist, and Dynamics 365 Global Black Belt at Microsoft on
Introduction
If you have ever worked with the Electronic Reporting feature within Dynamics 365 Finance & Supply Chain Management, then you have probably spent a little bit of time trying to find out which are the right fields to bind within the data models. You have probably bound a field, thinking that it is the right one, only to find that the field is blank, and then all your electronic reports start failing.
I know how frustrating this can be, because I spent half a day trying to find where the customers email address was stored in the data model
Then I discovered that there is a handy feature within the Electronic Reporting, that allows you to Debug the data that is being returned by the Electronic Reporting, while you are running the reports.
As soon saw this, all my data hunting and pecking became a thing of the past.
In this quick do!torial, I will show you how to turn on the Electronic Reporting Debugging, and how it works.
Topics Covered
- Enabling Electronic Reporting Debugging
- Debugging Electronic Reporting
- Exploring the Data Model
Enabling Electronic Reporting Debugging
The first task that we need to do is to turn on the debugging feature for the Electronic Reports within Dynamics 365.
How to do it…
Step 1: Open the Electronic Reporting form
To turn on the Electronic Report debugging feature we will want to go to the Electronic Reporting workspace.
We can access the Electronic Reporting form through the main menu.
To do this, we will need to open the navigation pane, expand out the Modules and group, click on the Organization Administration group to see all the available menu items and then click on the Electronic Reporting menu item within the Workspaces group.

Step 2: Click the Reporting configuration tile
Then we will want to open the Reporting Configuration page.
To do this, all we need to do is click on the Reporting configuration tile.

This will open the reporting configuration page for us where we will be able to see all of the different Electronic Report configurations and models.

Step 3: Click the User parameters button in the Advanced settings group of the Configurations action pane
Now we will want to access the user parameters for the electronic reporting.
To do this, just click on the User parameters button within the Advanced settings group of the Configurations action pane tab.

This will open the User parameters configuration panel, and we will see that there are a lot of different options that we can configure for Electronic Reporting.

Step 4: Toggle the Enable data debugging at format run field and click the OK button
We are just interested in enabling the data debugging at format run.
To do this, we will need to toggle the Enable data debugging at format run option and click on the OK button.
This time, we will want to toggle Enable data debugging at format run to Yes .

Debugging Electronic Reporting
Now that we have enabled the debugging feature within Electronic reporting, we can now take a look at it in action.
How to do it…
Step 1: Click the Sales order record and click the Confirmation button in the Generate group of the Sell action pane
For this example, we will be debugging the sales order confirmation process. We have a Sales Confirmation Configurable Business Document configured within our system, and it is also configured to send the order confirmation to the customer, using the primary email address that is on the customer’s account.
We are having a problem finding the right email address field, so we will use the debugging feature to find it for us.
To do this, click on the Sales order record and click on the Confirmation button within the Generate group of the Sell action pane tab.

Step 2: Toggle the Print confirmation field, toggle the Use print management destination field and click the OK button
When the Confirm sales order dialog box is displayed, we will want to print the confirmation using the print management.
To do this, toggle the Print confirmation option, toggle the Use print management destination option and click on the OK button.
This time, we will want to toggle Print confirmation to Yes, toggle Use print management destination to Yes .

This will start the process of printing the Sales confirmation report.

Step 3: Click the Yes button
Since we have the debugging enabled for the electronic reports turned on, we will not go straight to the report, we will be asked if we want to debug the electronic document.
Which we want to do.
To do this, just click on the Yes button.

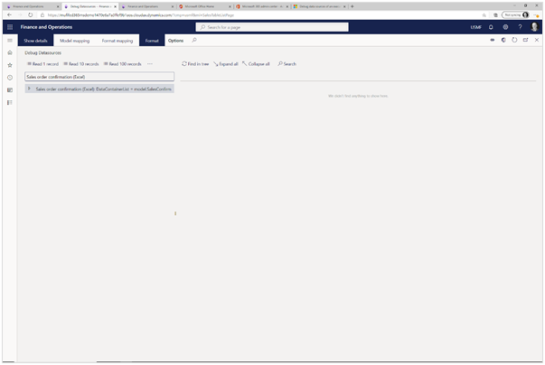
Now, rather than seeing the sales order confirmation report, we will be taken into the Debug Datasources explorer panel.
Exploring the Data Model
Now that we are in debug mode for the Electronic reporting, we can do a lot of different things, including browsing the data that is being returned from the data model, which is the data source for our Sales order confirmation.
How to do it…
Step 1: Click the Format mapping button
We will want to switch our view so that we can see the model mapping details.
To do this, just click on the Format mapping button.

Step 2: Expand the model Record node
Let’s explore the data that we are working with.
To do this, all we need to do is expand the model Record node.

Step 3: Expand the SalesConfirm Record list node
Now that we can see that we are getting data back from the SalesConfirm record list, let’s see what fields are there.
To do this, just expand the SalesConfirm Record list node.

Step 4: Expand the Buyer customer party Record node
Now we will see all the fields that are mapped to the data source. Let’s drill further into the data source and look at the data that is in the customer party record.
To do this, just expand the Buyer customer party Record node.

Step 5: Expand the Party Record node
Now we will drill into the party details.
To do this, all we need to do is expand the Party Record node.

Step 6: Expand the Contact Record node
Now we are getting somewhere. We suspect that the email address is in the Contact record, so let’s drill in further.
To do this, expand the Contact Record node.

Step 7: Click the ElectronicMail String node
Under that node we can see that there is an ElectronicMail field that is probably where the email address is stored.
Let’s select that field.
To do this, just click on the ElectronicMail String node.

Step 8: Click the Get value button
Now we can get the value that is being passed through to the data model.
To do this, just click on the Get value button in the menu bar.

Step 9: Click the Expand all button
On the right hand panel we will now see that there is a Record model showing up. This is where we will be able to see the data that is linked to our data model.
To do this, just click on the Expand all button in the menu bar.

When we expand out the record model, we will see that the ElectronicMail field has a value, and that is what we are looking for.

Review
How cool is that? Now we don’t have to guess what data is being returned through Electronic Reporting. We can use the debugging feature to wrangle our records and see where the data is within the data model.
This is a huge timesaver, and takes all of the guesswork out of linking data from the Electronic reporting models.
Share this post
- 0 comment
- Tags: Uncategorized
0 comment