Using RSS Feeds As PowerView Data Sources
Posted by Author, Curator, Visually Impared Squirrel Literacy Advocate & Dynamics AX Technical Solution Professional (TSP) at Microsoft on
A lot of social media and search sites have the option to output the results as RSS feeds as well as the normal human readable version. PowerPivot has the option to use XML feeds as the source for its’ data sources. It just makes sense to marry the two features together and create Power View dashboards that summarizes the live feeds so that we can start analyzing the searches that we are interested in.
In this walkthrough will show you how easy that is to do.
Creating a PowerPivot RSS Data Source From Twitter
Twitter is a great tool for tracking what the Twitterverse is thinking about and also a great source for mining information. Finding out who is tweeting the most, who is the most influential, and also what the hot topics are and presenting it as a live dashboard should be useful to everyone.
In this short example we will show you how to convert a Twitter search into an RSS feed, use it within PowerPivot to create a data source, and then create a Power View dashboard from the data.
Getting ready
Converting a Twitter search into an RSS feed is pretty simple.
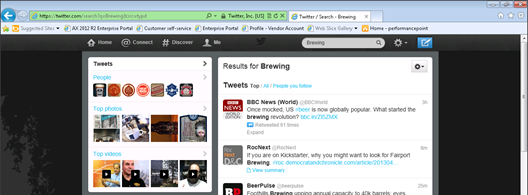 Once you have the search term that you want to return as RSS. Just use the following URL format: http://search.twitter.com/search.atom?q=”Term”
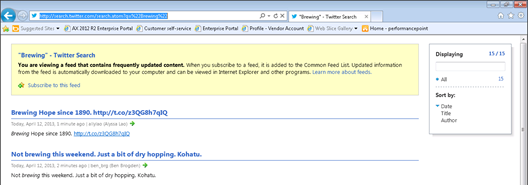
How to do it…
To create a PowerPivot RSS Data Source from Twitter, follow these steps:
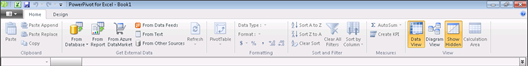
- Open up Excel and select the From Data Feeds option from the Get External Data group on the Home tab.
- Paste in the RSS Feed URL into the Data Feed Url field.
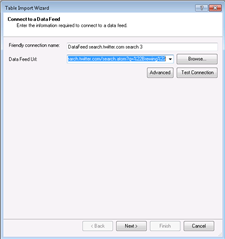
- Before continuing on, click on the Advanced button to make some changes to how the feed is read. In the advanced form, set the Include Atom Elements property to True, the Include Data Service Content to True and the Include Expanded Entries to False.
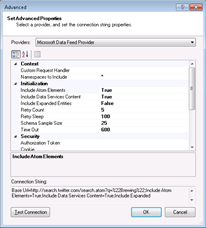
- To make sure that the feed results are readable by PowerPivot, you might want to click on the Test Connection button. If everything is successful, click on the OK button.
- Click OK and you will then see the data that is being imported. Before clicking Finish, you may want to view the results by clicking on the Preview & Filter button.
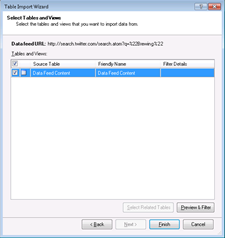
This gives you the chance to make sure that all of the data is being returned in the right format.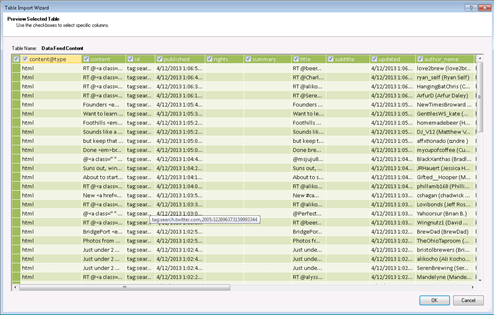
- After the data is imported, click Close.
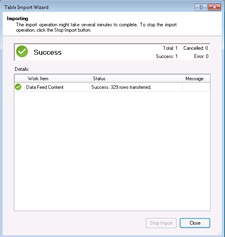
Now you should see all of your Twitter search results in your PowerPivot worksheet.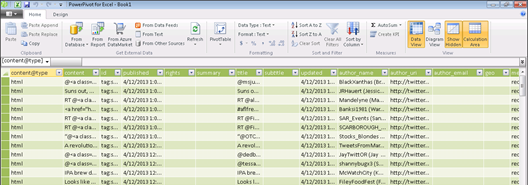
- From the File menu, select the Save & Send menu item and Save to SharePoint.
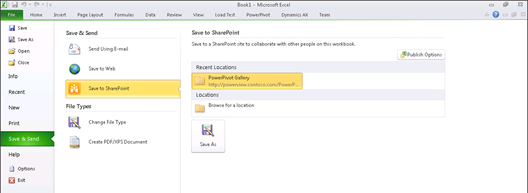
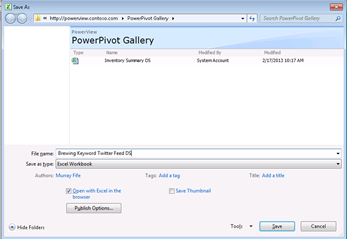
- This will take you to your PowerPivot Gallery, and you can give your data source a name.
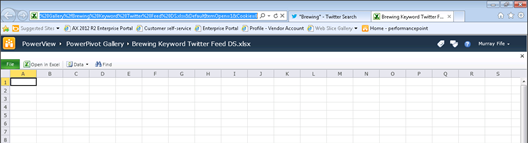
- Once the data source is published, it will automatically take you to the web view of the published worksheet. Click on the PowerPivot Gallery link at the top to see all of the data sources.
How it works…
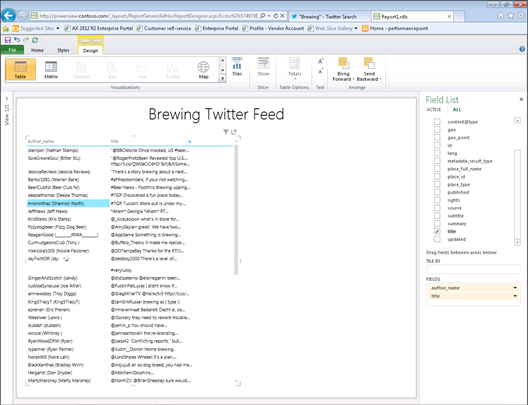
To create a Power View dashboard from the data source, just click on the Power View Designer icon at the top right of the data gallery item. 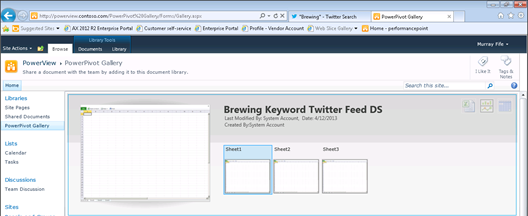
You will then be taken to the designer. To create a summary list of all your tweets, select the author_name and title fields
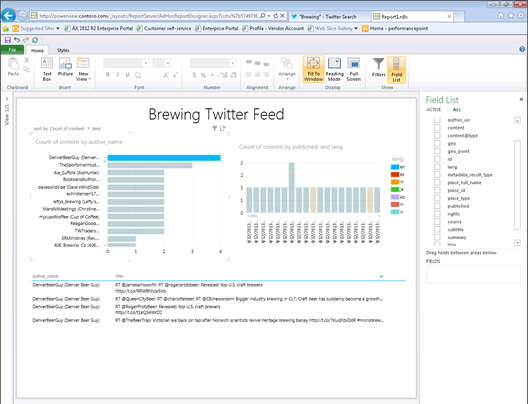
After adding a little more panels to your dashboard you can start drilling in and analyzing the Twitterverse.
Summary
Using RSS feeds as data sources gives you a way to add context to your standard data. Some other things that you may want to try include:
- Create formula fields for fields like dates so that you can analyze the data by year, month, date, time of day, day of week etc. to spot trends.
- Link the feeds to data within the ERP, like contacts so that you can have dashboard information displayed alongside the standard data.
In addition to Twitter, try doing the same for other RSS feed enabled services like:
- Bing
- Blogs
This is cool stuff. Give it a try.
Share this post
0 comment